Dashboard and Analytics
Most YouTube creators are flying blind when it comes to understanding which videos actually drive business results. YouTube Analytics tells you views and watch time, but it cannot tell you which video sent someone to your website, generated a lead, or resulted in a sale. Without this data, you are guessing which content to create more of and which topics to abandon.
The VideoStats Dashboard solves this by connecting your YouTube content directly to your business metrics. For the first time, you can see exactly which videos generate clicks, leads, and sales, so you can make confident decisions about your content strategy.
Date Range Selector
At the top of your dashboard, you will find a date range selector. This controls the time period for all the data displayed below. You can:
- View the past 7 days, 30 days, or custom date ranges
- Compare different time periods to spot trends
- Focus on specific campaign periods or product launches
All charts and statistics on the page update automatically when you change the date range.
Key Metrics Overview
The top row shows your four most important metrics at a glance:
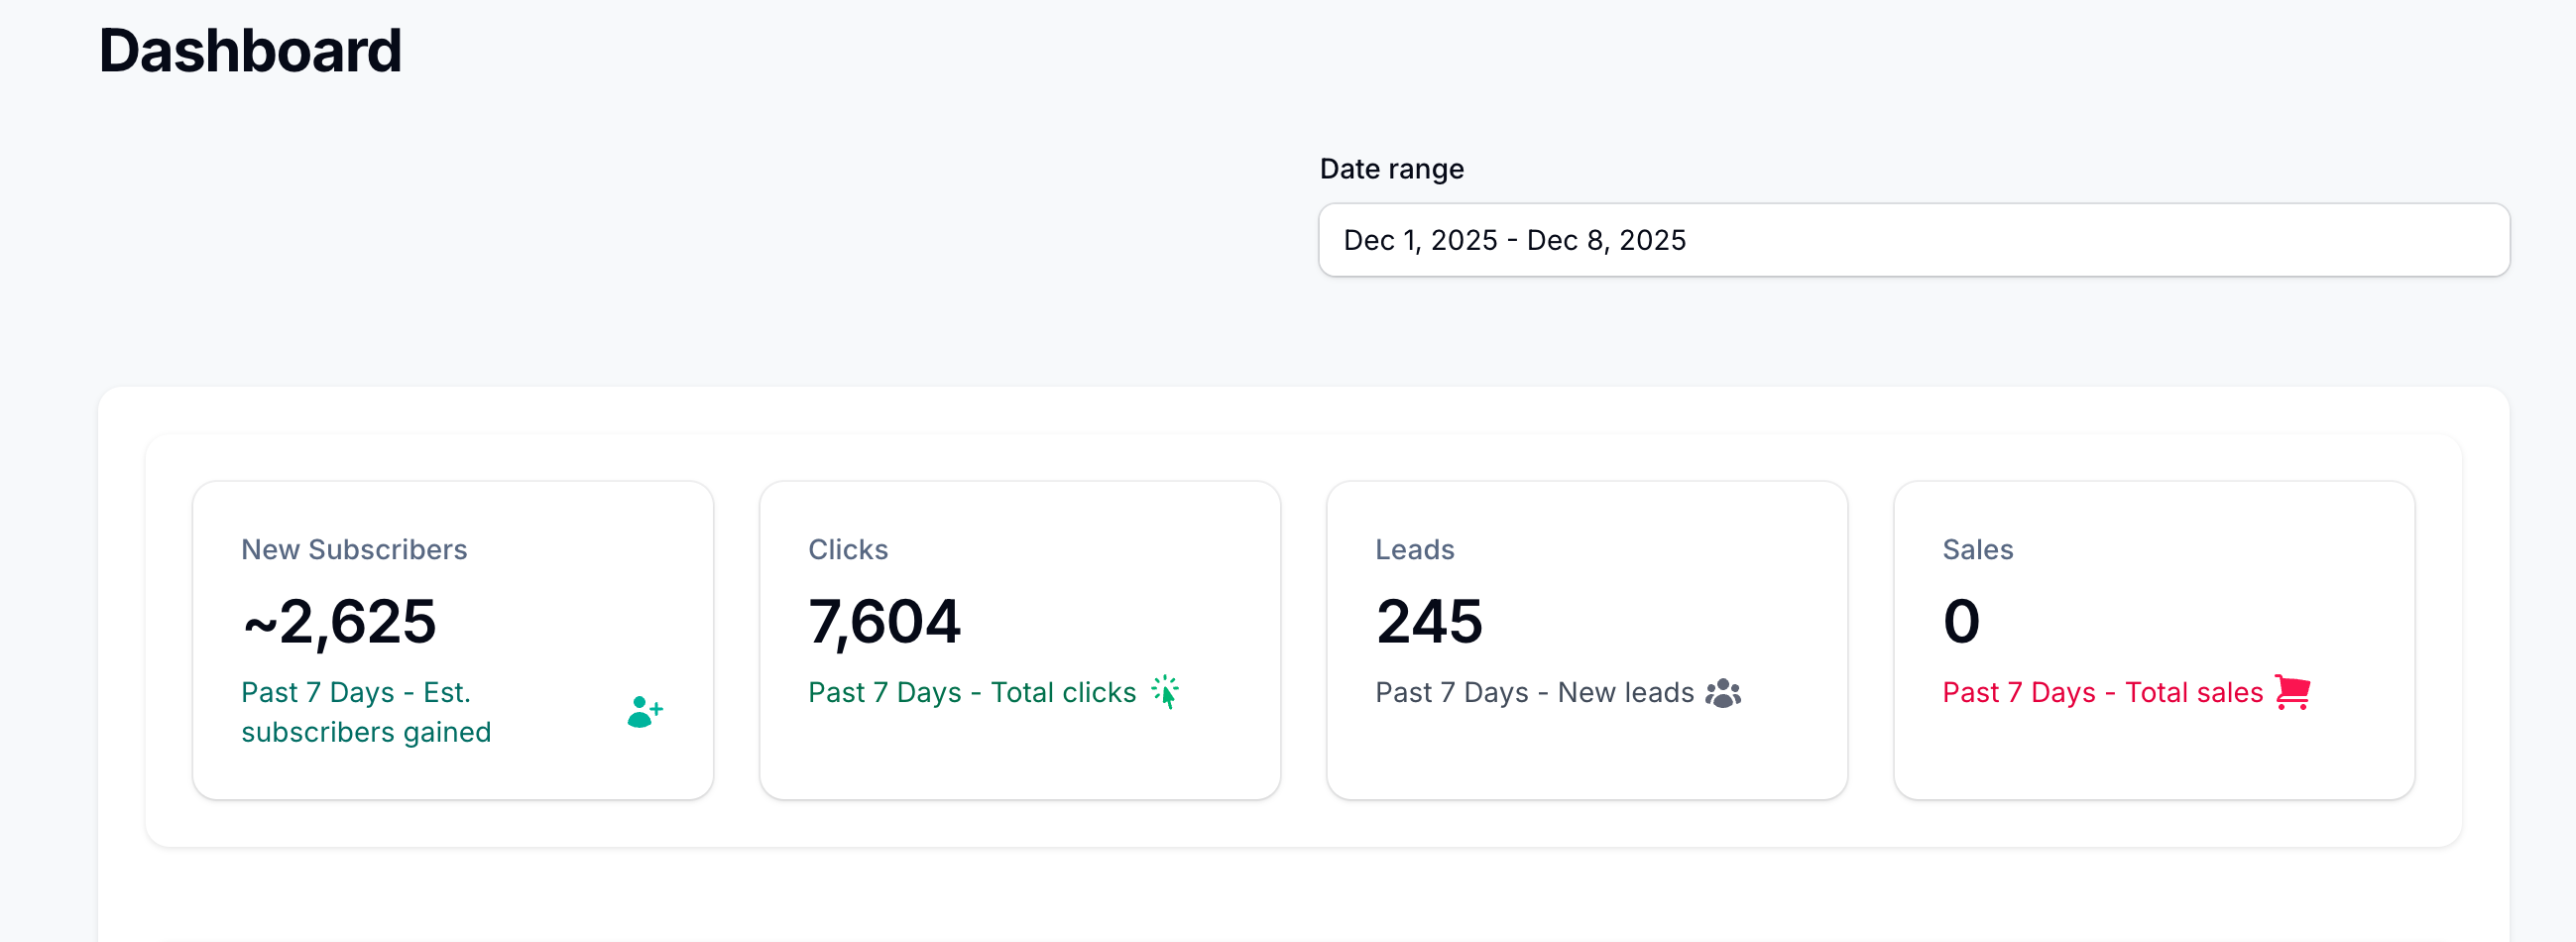
New Subscribers
The estimated number of new YouTube subscribers gained during the selected period. This helps you understand your channel growth and whether your content strategy is attracting new audience members.
Clicks
The total number of times people clicked on your tracked links. This tells you how effectively your videos are driving traffic to your websites, landing pages, and offers. High click numbers mean your calls-to-action are working.
Leads
The number of people who converted after clicking your links. A lead is typically someone who opted in to your email list, signed up for a free resource, or took another conversion action. This is where you start seeing real business value from your content.
Sales
Revenue or transactions attributed to your YouTube content. When you have sales tracking configured, you can see exactly how much money your videos are generating. This is the ultimate measure of your content's business impact.
YouTube Channel Views
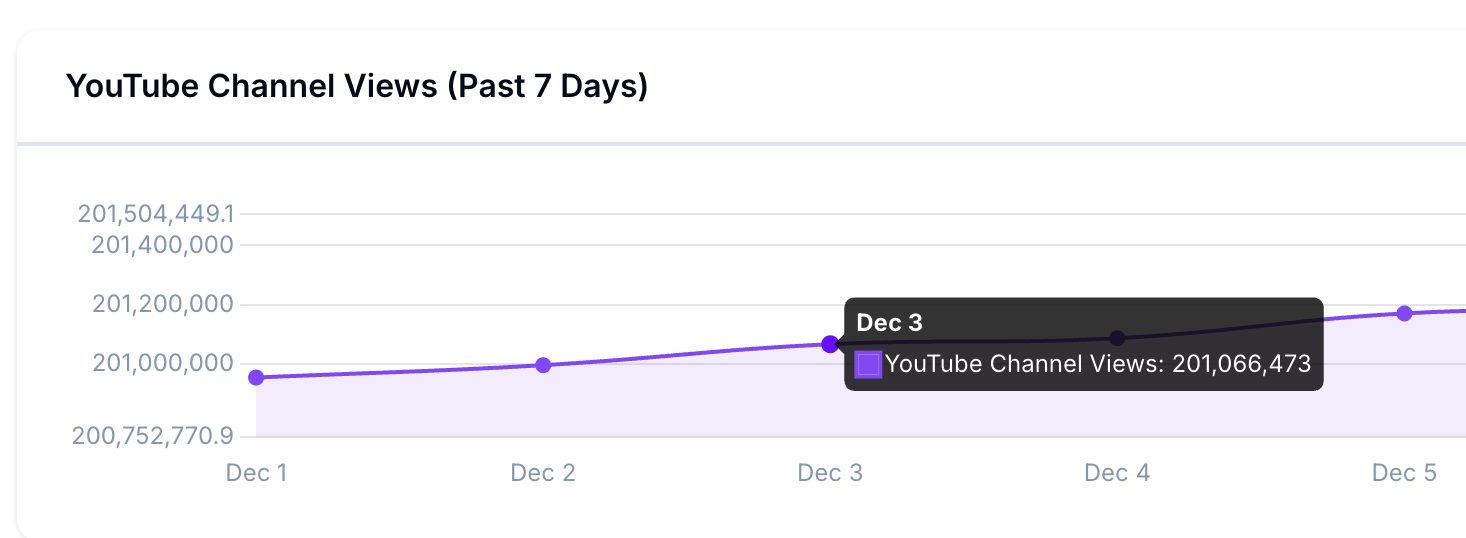
This chart shows your total channel views over time. Use it to:
- Spot trends in your overall channel performance
- Identify days when views spiked (often from a video going viral or being recommended)
- Correlate view increases with specific content you published
Clicks Chart
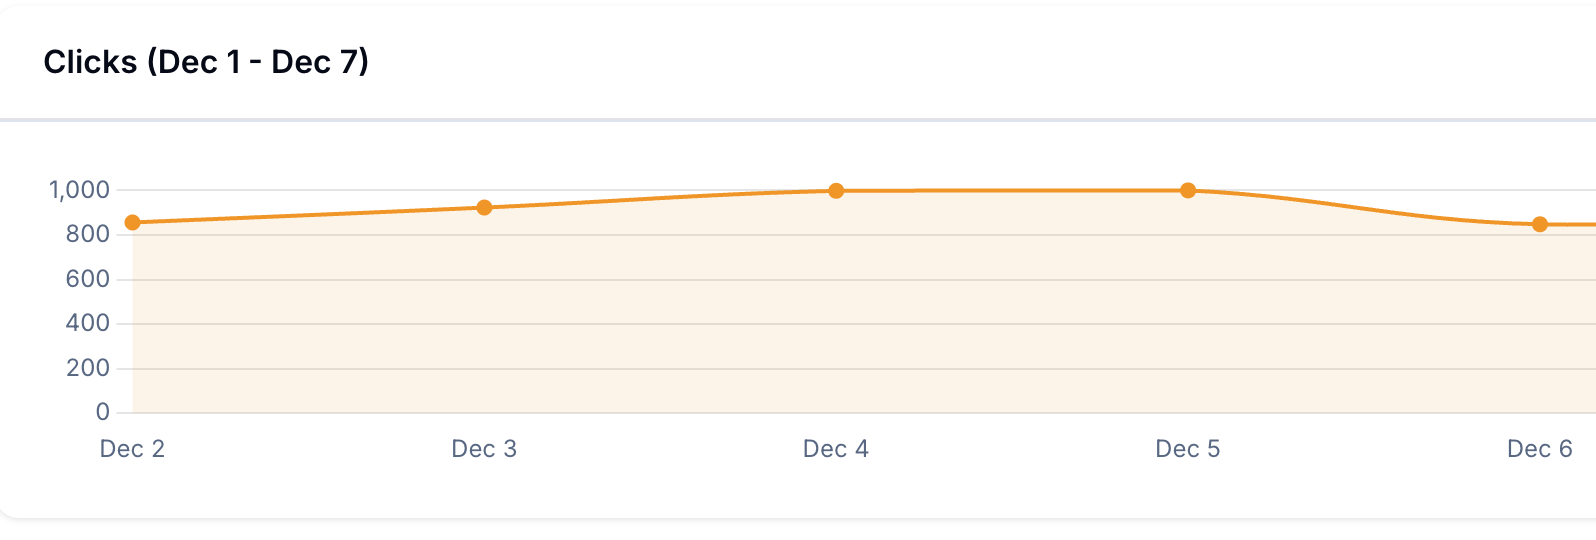
This chart displays your tracked link clicks over time. It helps you understand:
- Which days generate the most traffic from your videos
- Whether your click volume is growing over time
- How click patterns relate to your publishing schedule
Consistent or growing clicks indicate that your audience is engaged and taking action on your recommendations.
YouTube Subscribers
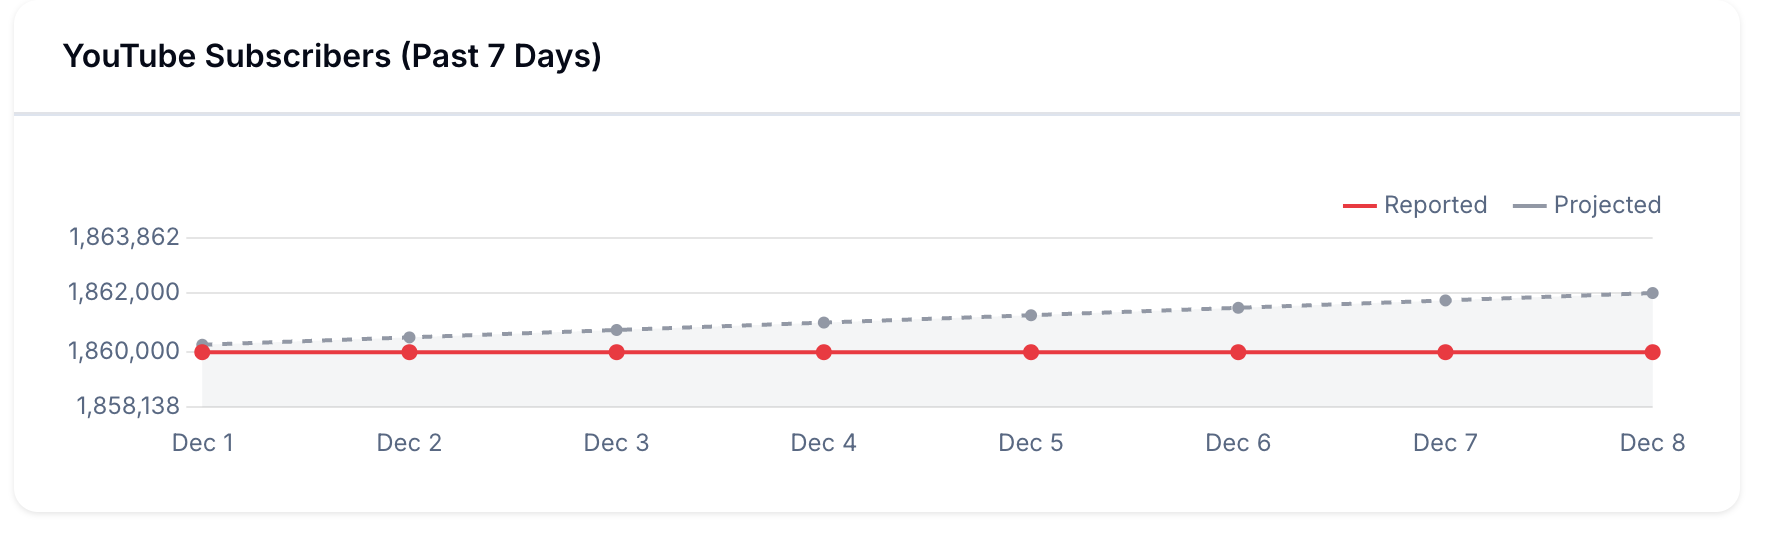
This chart tracks your subscriber count over time with two lines:
- Reported: Your actual subscriber count as reported by YouTube (shown in steps because YouTube rounds subscriber numbers)
- Projected: A smoothed estimate that shows the likely true growth trend
This dual view helps you understand your real growth rate even when YouTube's rounding makes the actual numbers appear flat.
Leads Chart
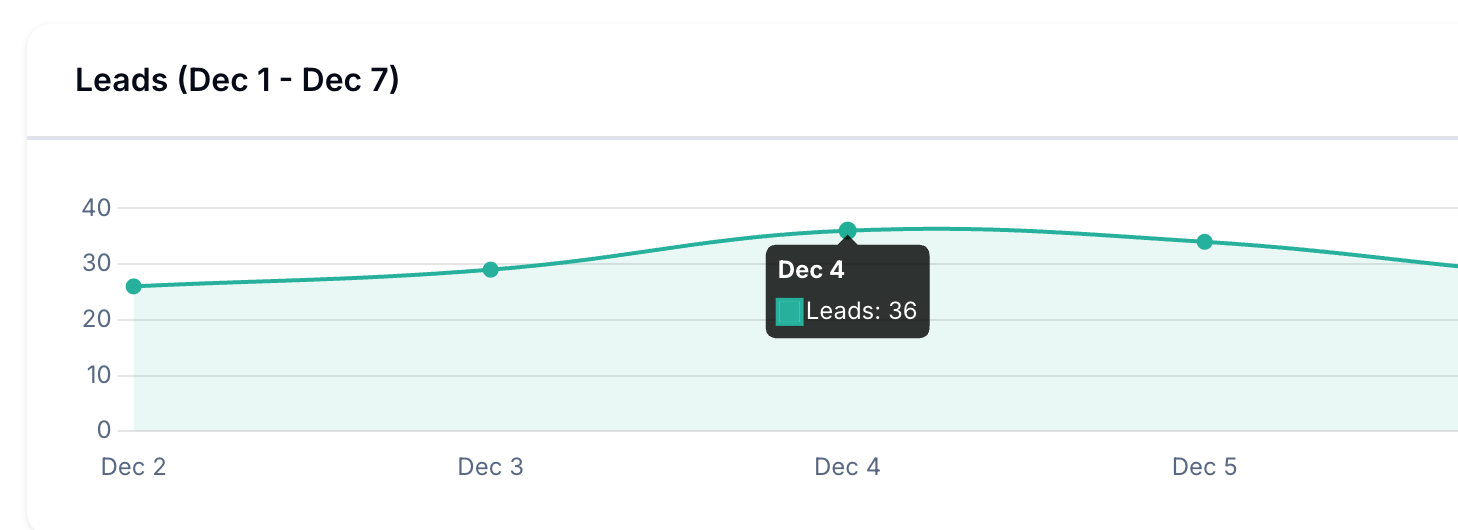
This chart shows your lead generation over time. Use it to:
- See which days produce the most conversions
- Identify patterns in when your audience is most likely to opt in
- Measure the impact of new videos or promotional pushes on lead generation
Conversion Analytics
Below the charts, you will find detailed tables that answer the most important question: which content is actually driving results?
Top Converting Videos
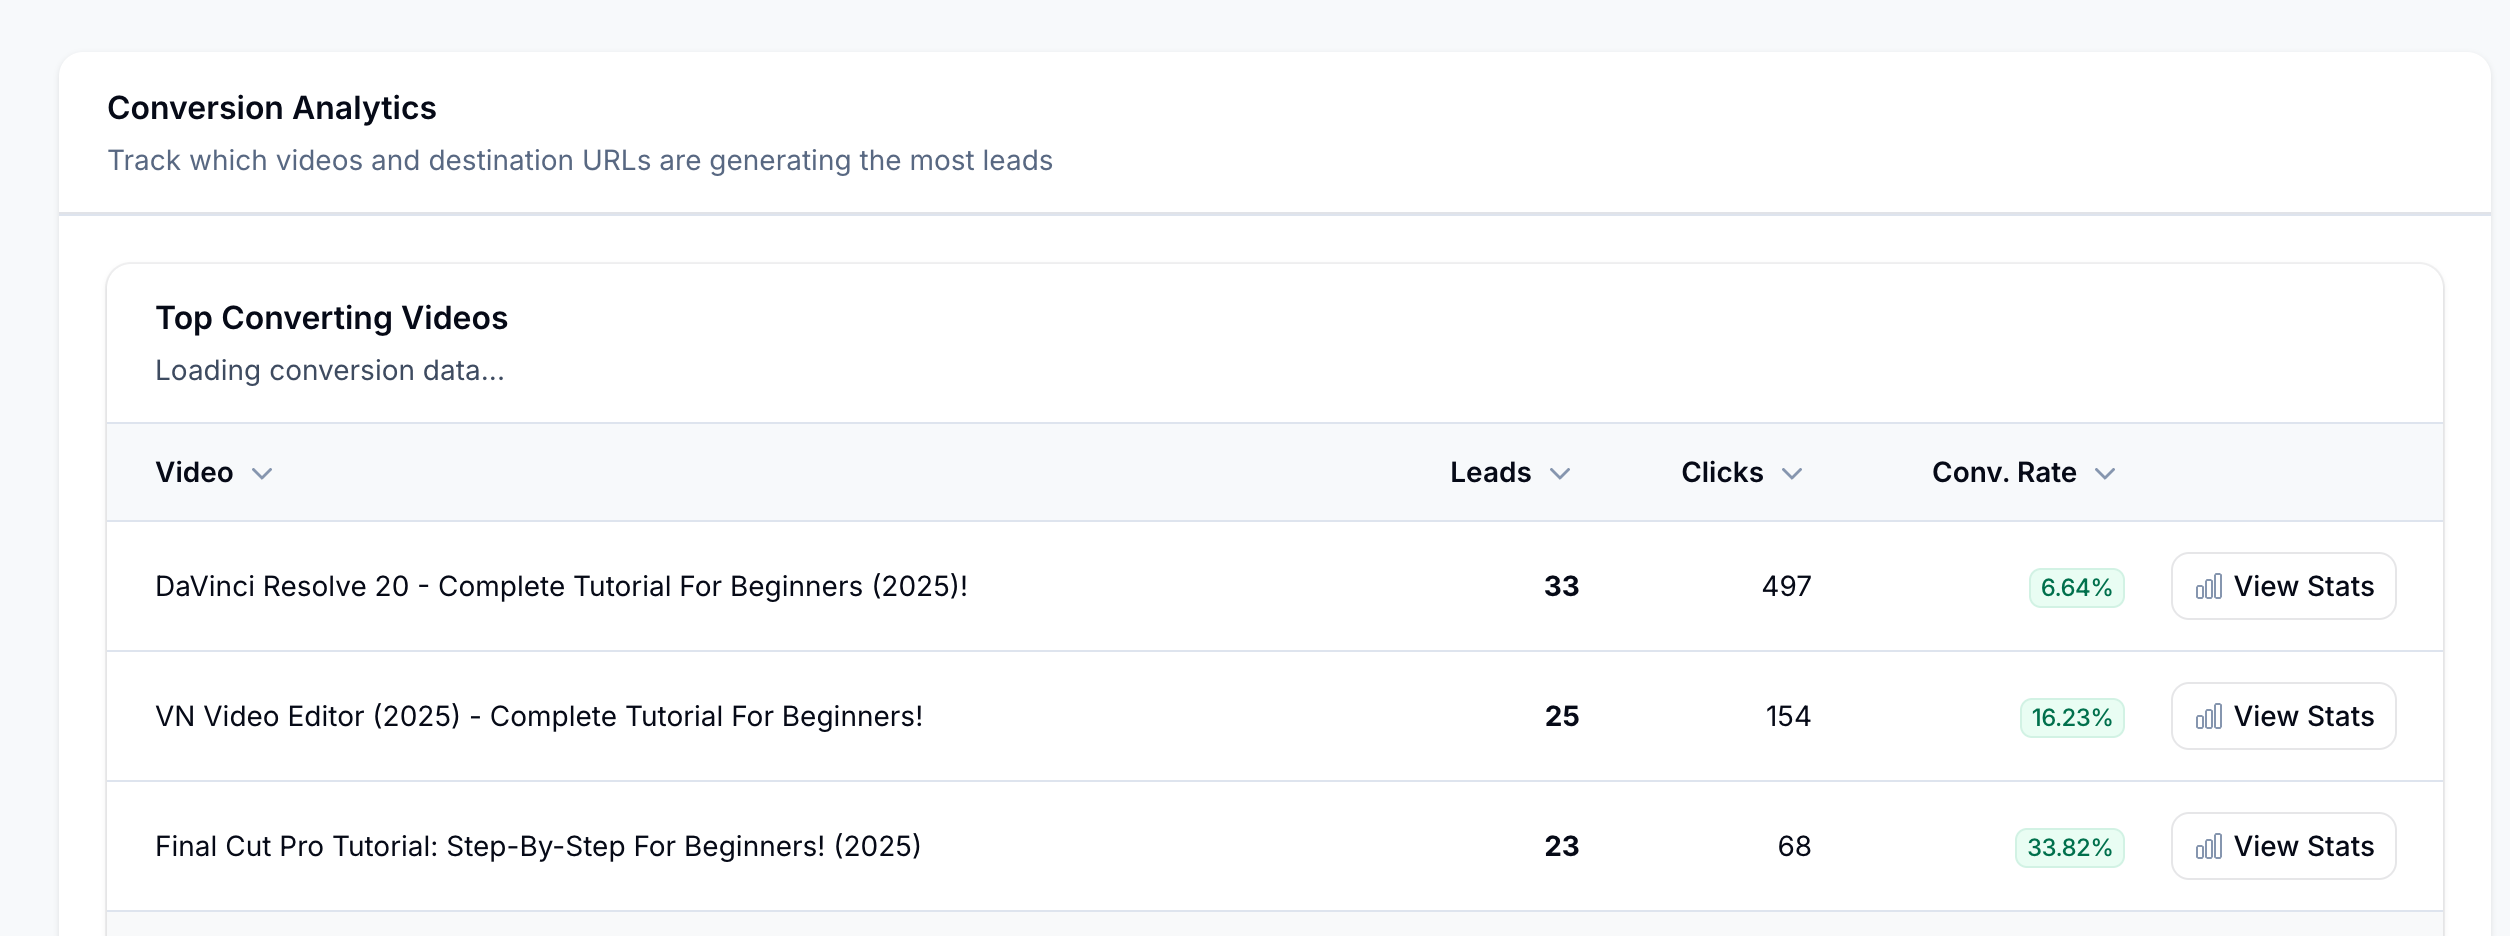
This table shows which of your YouTube videos are generating the most business results. For each video, you can see:
- Video: The title of your YouTube video
- Leads: How many leads this video generated
- Clicks: How many link clicks came from this video
- Conv. Rate: The percentage of clicks that became leads (higher is better)
- View Stats: Click to see detailed analytics for that specific video
This is incredibly valuable because it tells you exactly which videos to make more of. If a tutorial on a specific topic has a 33% conversion rate while another has only 1%, you know where to focus your content efforts.
Top Converting URLs
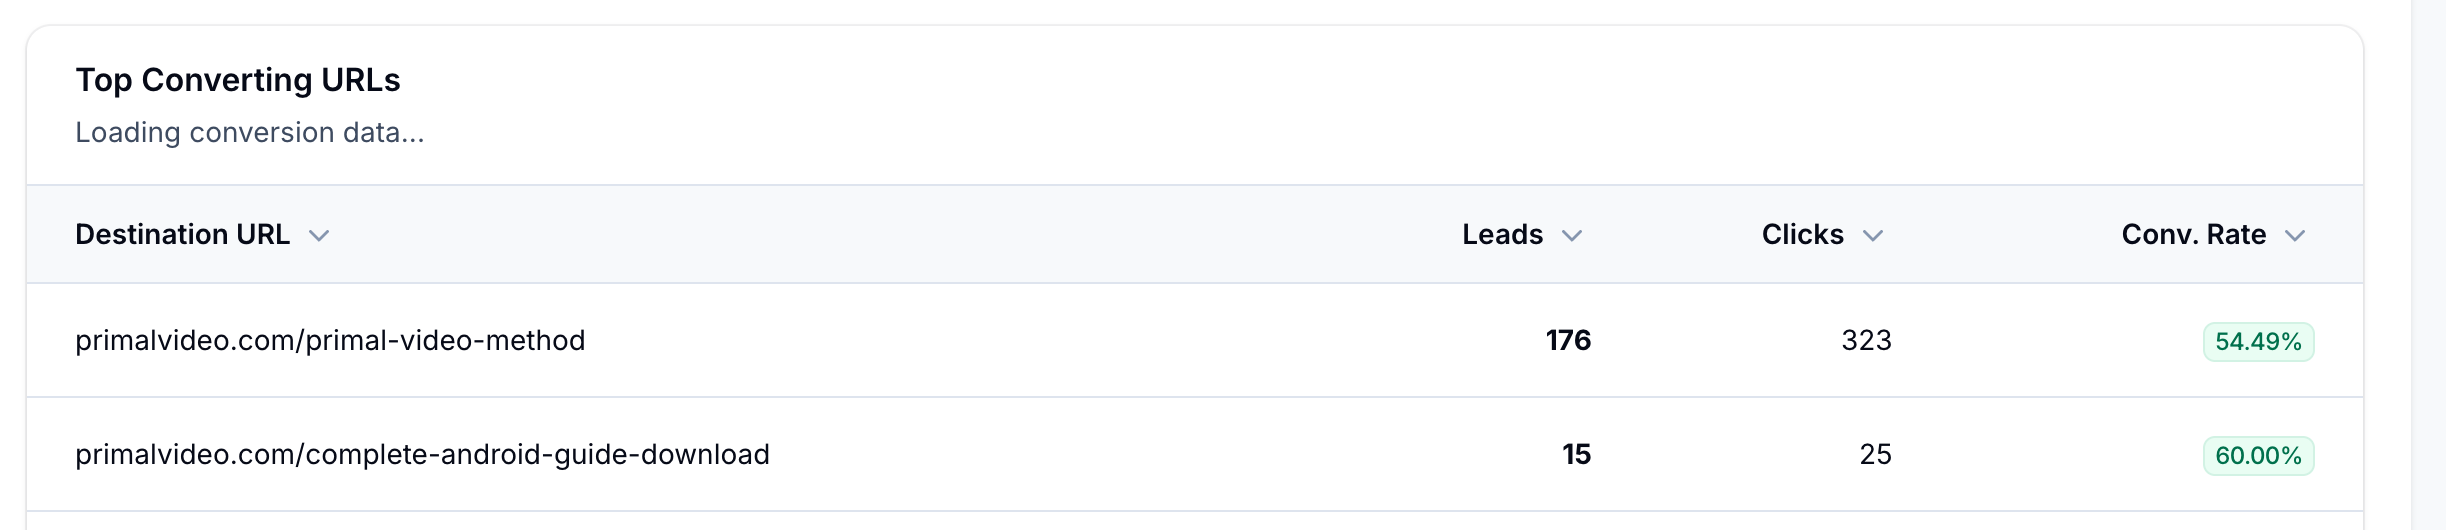
This table shows which destination pages are performing best. For each URL, you can see:
- Destination URL: The page you are sending traffic to
- Leads: How many leads this page generated
- Clicks: How many clicks this page received
- Conv. Rate: The percentage of visitors who converted
Use this to identify which landing pages, opt-in forms, or product pages are most effective. If one page converts at 59% and another at 2%, you might want to send more traffic to the higher-converting page or improve the underperforming one.
Making Data-Driven Decisions
With this dashboard, you can now answer questions like:
- Which video topics should I create more content about?
- Which videos should I promote or feature more prominently?
- Are my calls-to-action effective at driving clicks?
- Which landing pages need improvement?
- Is my content strategy generating real business results?
- How does my lead generation change over time?
Tips for Using Your Dashboard
- Check weekly: Review your dashboard at least once a week to spot trends
- Compare time periods: Look at how this week compares to last week or last month
- Focus on conversion rate: A video with fewer clicks but higher conversion rate may be more valuable than one with many clicks but low conversion
- Look for patterns: Notice which video topics and styles consistently perform well
- Take action: Use the data to inform what content you create next