Audience Retention Data
Audience retention shows you exactly how viewers engage with your YouTube videos over time. This powerful feature reveals where viewers stay hooked, where they drop off, and which parts they rewatch—helping you create better content that keeps people watching.
What is Audience Retention?
When someone watches your video, YouTube tracks how long they stay. Audience retention displays this data as a graph showing the percentage of viewers still watching at each point in your video.
For example, if your retention shows 65% at the halfway point, that means 65% of viewers who started your video are still watching at that moment. A gradual decline is normal—but sudden drops can reveal problem spots in your content.
Where to Find Retention Data
To view retention data for any video:
- Go to your Dashboard
Click on Video Performance in the sidebar
- Click on any video to open its details
Scroll down to see the Audience Retention chart
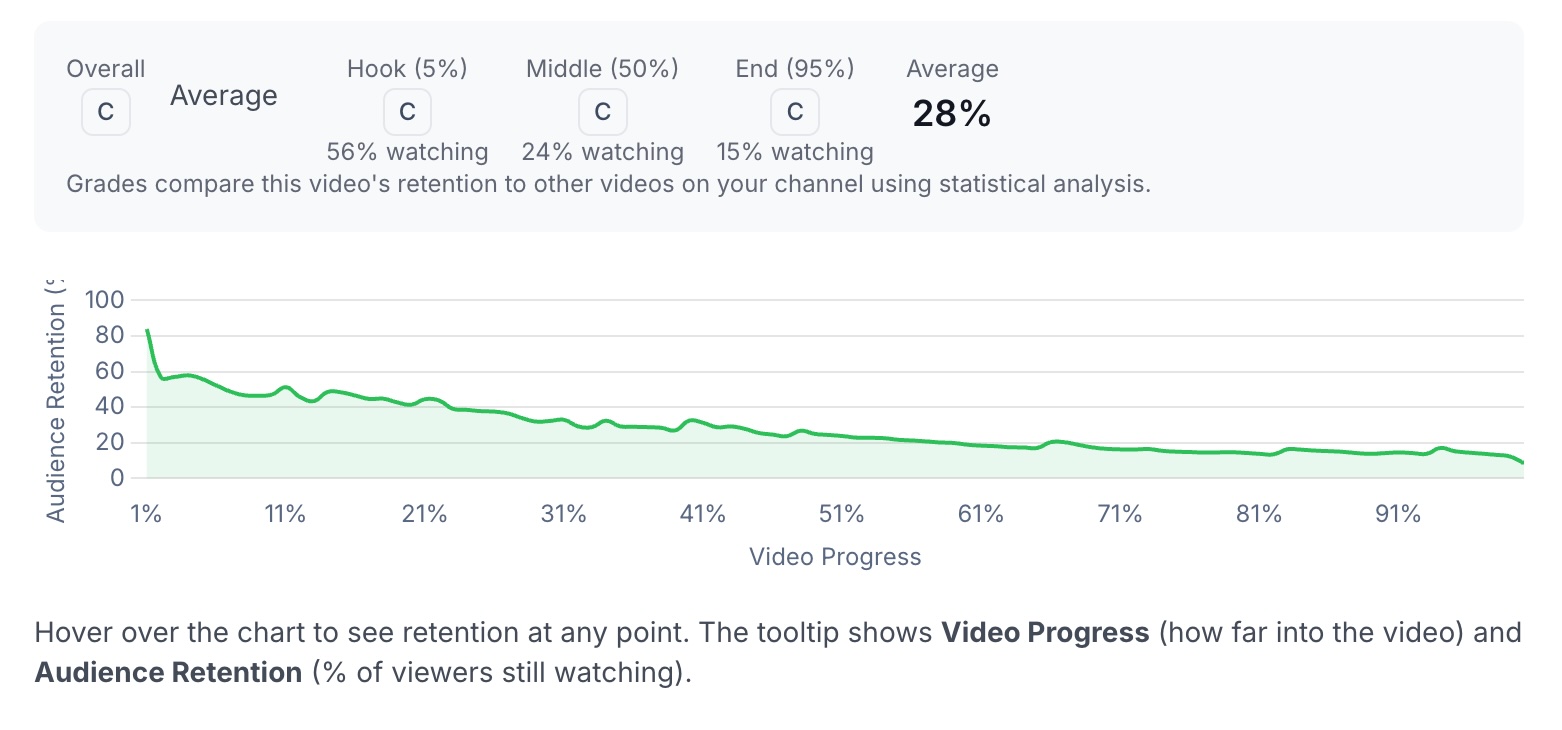
Understanding the Chart
The retention chart displays:
- X-axis (horizontal): Video progress from 0% to 100%
- Y-axis (vertical): Percentage of viewers still watching (0% to 100%)
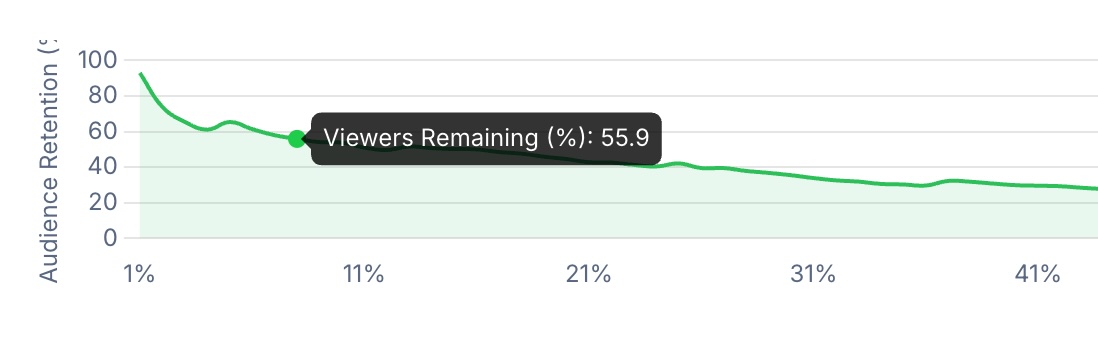
How to read it:
- Hover over any point on the chart to see the exact retention percentage
- A flat line means viewers are staying engaged
- A steep drop indicates viewers are leaving at that point
- Bumps upward can indicate rewatched sections
Requirements for Retention Data
Retention data becomes available when:
- Your video has at least 100 views — YouTube requires a minimum number of views before providing retention analytics
- Your plan includes retention data — This feature is available on Pro plans and higher
If your video doesn't have enough views yet, you'll see a message showing your current view count and the threshold needed.
Fetching and Refreshing Data
First time viewing: If retention data hasn't been fetched for a video yet, you'll see a "Fetch Retention Data" button. Click it to pull the data from YouTube.
Refreshing data: Use the "Refresh" button to get updated retention data. This is useful if:
- Your video has gained significant views since the last fetch
- You want to see how retention has changed over time
The data typically takes 10-30 seconds to load from YouTube.
Retention Grades
Once you have retention data for 10 or more videos, we'll automatically grade each video's retention performance compared to your other videos. This answers the question: "Is this video's retention good or bad for my channel?"
What the Grades Mean
| Grade | Description |
|---|---|
| A | Exceptional — This video significantly outperforms your channel average |
| B | Above Average — Better retention than most of your videos |
| C | Average — Typical performance for your channel |
| D | Below Average — Underperforming compared to your other content |
| F | Needs Improvement — Significantly below your channel's norm |
Section Grades
You'll see grades for three key moments in your video:
- Hook (5%) — How well your intro captures viewers. A strong hook keeps people from clicking away in the first few seconds.
- Middle (50%) — How engaging your core content is. This shows whether viewers stay interested through the main body of your video.
- End (95%) — Your completion rate. A high grade here means viewers are watching all the way through.
Why Grades Matter
Grades use statistical analysis to show what's exceptional versus normal for your specific channel. A video with 45% average retention might be an "A" on one channel but a "C" on another—it depends on your typical performance.
This makes grades more useful than raw percentages alone. Instead of wondering "is 45% good?", you'll know exactly how each video compares to your own content.
Note: Videos under 5 minutes are excluded from grade calculations since short-form content has fundamentally different retention patterns.
How to Use This Data
Identify Your Best Intros
Compare the Hook grades across your videos. Videos with "A" grades at the 5% mark have intros worth studying and replicating.
Find Drop-Off Points
Look for sudden drops in the retention curve. These reveal moments where viewers lose interest. Common causes include:
- Slow pacing
- Off-topic tangents
- Overly long explanations
- Poor audio/video quality
Spot Rewatch Moments
Bumps or plateaus in the curve can indicate sections viewers replay. These are often your most valuable content moments—consider creating more content like this.
Track Improvement Over Time
Refresh retention data periodically to see if your newer videos are improving. Rising grades over time indicate your content strategy is working.
Frequently Asked Questions
Why can't I see retention data for my video?
Your video needs at least 100 views before YouTube provides retention analytics. Keep promoting your video, and check back once it crosses this threshold.
Why don't I see any grades?
Grades appear once you have retention data for at least 10 videos. This ensures the statistical comparison is meaningful. You'll see a progress indicator showing how many videos you have versus the 10 required.
How often should I refresh retention data?
We recommend refreshing after your video has gained significant views (e.g., doubling from 500 to 1,000 views). Retention patterns can shift as your video reaches different audiences.
Why is my short video excluded from grades?
Videos under 5 minutes have naturally higher retention since they're easier to watch in full. Including them would unfairly skew the comparison, so they're excluded from grade calculations.